Sales Suite
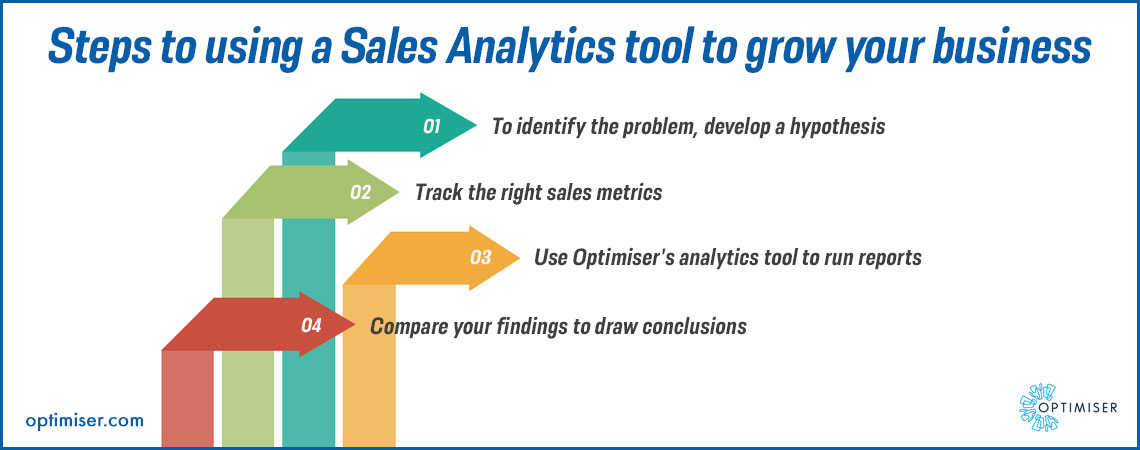
Steps to using a Sales Analytics tool to grow your business
Developing a sales analytics process is hit and trial. You pick a path, but you do not know where it leads. However, this process will give you a more precise look into how the path functions and what the customers experience while walking through it.
This 4-step process can be extremely useful for sales managers augmenting their first sales analytics endeavour using Optimiser's toolkit for sales team.
- The problem and the hypothesis
To use a sales analytics tool effectively, you will have to conduct research. In this step, develop a hypothesis that will be proven or disqualified after gathering and compiling sales metrics. This hypothesis can range from questions such as: Which channel brings in the most leads to Is upselling more cost-effective than bringing in new customers?
These are actionable questions that will allow you to gather a deeper insight into the performance of the sales within the organisation.
Also Read:Metrics You Should Have on Your Customer Dashboard
- Sales metrics
Choosing the right metrics will make the difference that you seek. It would benefit you, to begin by asking the following questions:
Which metrics are important for the developed hypothesis?
Which metrics will be of use for the process?
The occurrence with which data will be monitored: Will it be daily, weekly, monthly or quarterly?
How will you be compiling the data? The tool used for compiling is important. If you are using a spreadsheet, you are likely to face many errors. However, with the help of a sales analytics tool such as Optimiser, you can allow intelligent automation to collate the data and create reports for you. It will be unbiased, error-free and efficient which will improve transparency and accountability within the company.
Here are some sales, customer and sales reps metrics to track for your first sales analytics process:
Sales metrics to track
- Sales made to date, Sales growth and target
- Lead source, the average time that is taken by a lead to respond, and the conversion rate
- Sales process length and the pipeline stages
- Overall conversion rate
- Deal size, revenue made every sale and the average value of the sale
- The average cost of selling
Customer metrics to track
- Customer reception to selling methods
- Customer lifetime value or CLV
- Churn Rate
- Net promoter score
- Revenue from new and existing customers
Sales rep metrics to track
- New sales tools adoption
- Quota attained
- Overall sales made by every rep
- Sales analytics tools
Using Optimiser for the sales analytics process, you can efficiently go through the data without any errors. The best CRM for enterprise sales, the platform compiles all your data in one place. You do not have to sit through analysing rows of numbers all by yourself. You can interact with the data with an intuitive dashboard that will display the metrics you have placed on priority. The important tasks will show on the dashboard to let you know which have been accomplished and whose deadlines are approaching. Optimiser's dashboard presents the data in the most interactive manner with different colours and graphs. Easy to understand, sales managers and business owners can engage the employees with the data using visually appealing charts. None of the team members has to sit through tedious presentations. Instead, they can check the performance of the department on the dashboard from anywhere in the world and at any time.
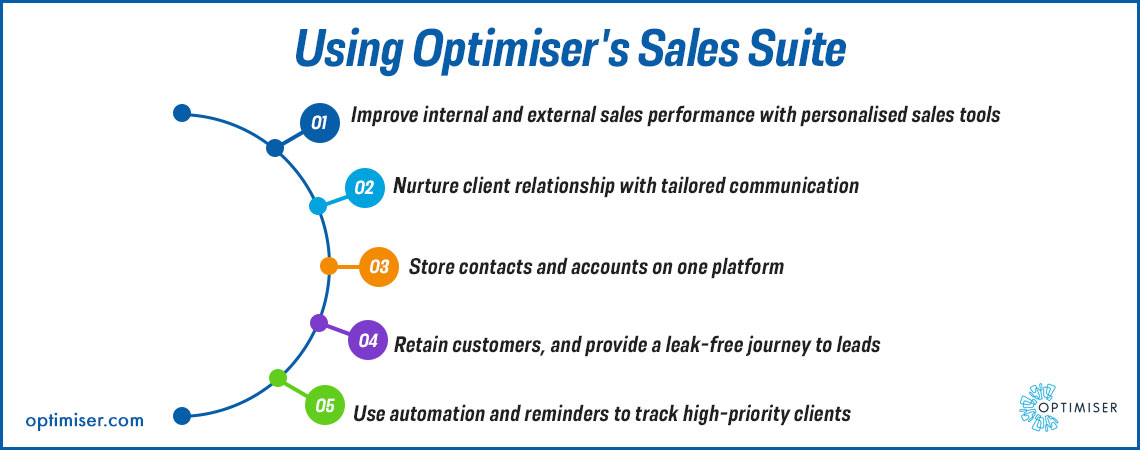
With the robust automation, you can run unlimited reports on Optimiser to gather historical, real-time and predictive data. This allows intelligent decision-making and ensures that the business can catapult forward in the competitive markets.
- The final analysis
With all the data that has been compiled and analysed, you will have to draw comparisons to verify your hypothesis. Have you found the answer to the question you started with? If not, you can develop a new hypothesis using the data in your hands and start afresh. None of your efforts are wasted. Because even if this has not answered your initial question, it has allowed you to learn more about your sales process from the inside out.
If the answer to your question has been found, then do not stop tracking data. This is the key mistake many sales managers make. You will need to make changes to your sales process after your findings. You will need new information that will allow you to keep your strategies fresh and unique.
Summary
To summarise, the sales analytics tool is an extremely useful means to understand your sales department in-depth and allows you to offer the most personalised experience to the customers that they will appreciate. This will increase the chances of you retaining them and boost your ROI in return.

30 days free trial. No credit card required