Sales Automation
Positive Key Sales Metrics to Watch Out
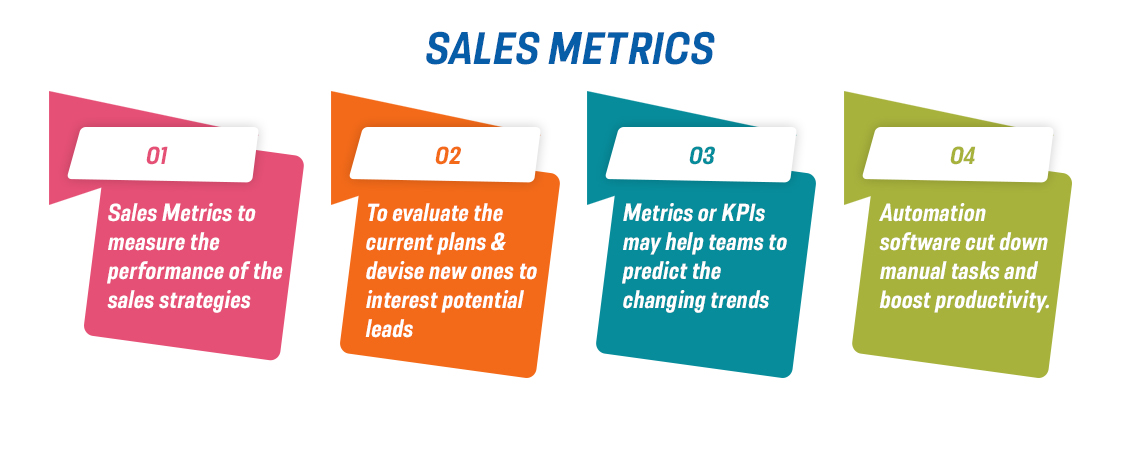
Sales teams use metrics to determine how the company is performing in the set period, adjust the compensation value, give out incentives to the employees, and identify the weak spots within the organisation. It is also used to predict changes in the market and prepare strategies to deal with the situation. These metrics are known as Key Performance Indicators or KPI. In addition, sales automation software delivers reports that summarise your performance. These reports can be used to devise new strategies.
“Sales is an outcome, not a goal. It's a function of doing numerous things right, starting from the moment you target a potential prospect until you finalize the deal.”
-Jill Konrath
Key Sales Metrics to Watch Out
Growth of Sales
Growth of sales depicts how much your revenues have increased or decreased over a specified period. It is more like a bird's eye view of sales and how your team performance has been. To determine how much your sales have grown over time, the formula is:
(S2 – S1) x 100
S1
This is an incredibly significant metrics as it gives you an overview of your performance. No organisation aims for stagnation, so it is vital to analyse healthy growth and implement strategies to maintain it. Also, this allows you to understand your team's performance and allow more accurate sales forecasting and planning effective sales strategies. Sales Toolkit for small businesses offered by CRM solutions companies such as Optimiser offer sales growth reports for the owners to track their business performance.
Sales Target
Evaluate the current sales number and compare them with your long term goals. To track this metric, you have to have a determined target. These are based on the previous rate of growth and revenue required for a further period. The sales target should be both achievable and ambitious. You should strive to gain more sales but ensure that your expectations are set on a quantifiable target and can be achieved.
You can compare the sales targets on a weekly, monthly, quarterly and yearly basis. Whichever is more useful to you. The measurement can range from monetary value, accounts opened, or even sales made.
If your sales target is predetermined, you can obtain your sales percentage.
You need to monitor whether or not your sales team can keep up with the target or not. It can be used as a motivational tool for the employees to contribute to the company's sales growth.
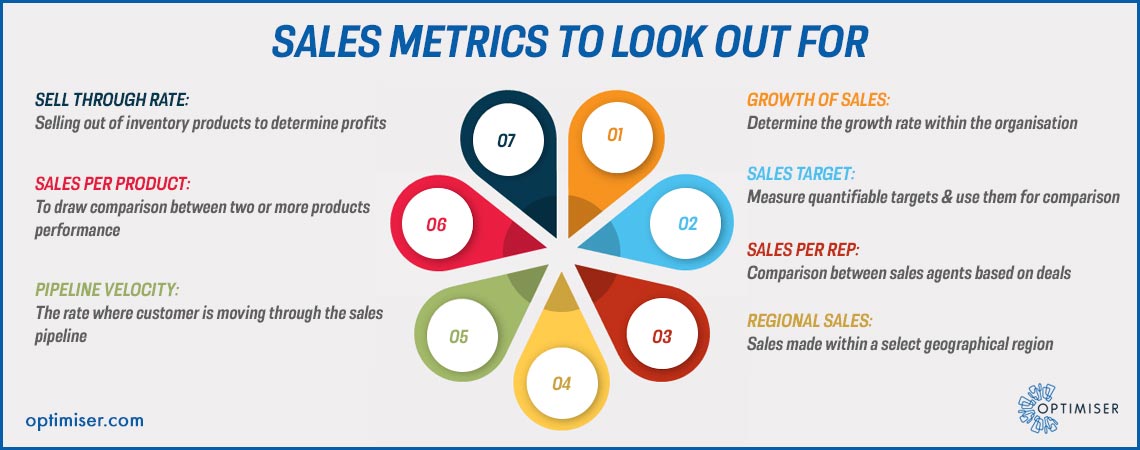
Sales Per Rep
The individual performance of the agents is Sales per rep. You simply need to track the sales made by each agent in a set period (weekly, monthly, quarterly).
The ideal thing to do is look for both the monetary value and the number of deals made. Sometimes, sales reps bring high-value customers but make lesser sales. Whereas other sales reps bring a record number of customers.
It would serve you well to take both into account. First, it is because some sales agents are more interested in bagging high-value clients. These have ultimate sales experience and can train newer sales reps in herding new customers. Sales Automation software can make it easier for you to track which sales rep brought in more clients and which one brought in high-value ones.
Regional Sales
This data explores the number of sales made within the geographical area where your business is situated. It can be specific to a territory, state, country and even a continent.
While global businesses draw their comparison within continents, smaller businesses can draw between districts or even states.
Regional sales tracking can be used to evaluate your sales strategy and implement a new one that bolsters your business. However, do not forget to consider factors such as population density, seasonal demands, etc.
Sell Through Rate
This measures how fast your inventory can sell out. This is a significant metric for retail shops that can help them monitor the performance of their chains and competitors. Higher the sell-through rate, the more profits you make. However, it does not mean that running out of products to make a profit is excellent. It is important to have an inventory strategy to have a continuous product flow and not be out of stock when people need it.
Sales per product
This is your product performance. This is used to measure how much profit each of your products has brought in. This displays which of your products is doing well and which isn't. This can allow you to set future planning of products and focus on those that bring out more profits.
Pipeline velocity
This determines how fast your leads move through the sales pipeline. So why is it an important metric?
Because you can use this for further planning and even business forecasting. If any factors change within the sales pipeline, you will determine and prepare a strategy to deal with it. Because if there is any effect on your pipeline velocity, your goals will be impacted. A sales toolkit for small businesses can be implemented to ensure that the customers are moving through the sales pipeline seamlessly. This makes sure that the customer who has had a good experience with the buying process is likely to refer you to their acquaintances.
Final Words
KPI tracking is extremely vital for tracking an organisation’s growth. These key performance indicators allow you to evaluate your sales strategies and track new trends in the market to update them.

30 days free trial. No credit card required